Understanding your project's usage and performance with Strapi Cloud observability
Last updated: July 8, 2026
The Strapi Cloud dashboard includes an Observability page that shows how your project consumes resources and how it behaves at runtime. To open it, select your project in the Strapi Cloud dashboard and go to the Observability tab, next to Deployments and Logs.
Before opening a support ticket about high usage, unexpected overage charges, or an unresponsive application, check this page first. In most cases it will show you exactly what happened and when. This article explains each section and how to use it to answer the most common questions we see in support.
Summary
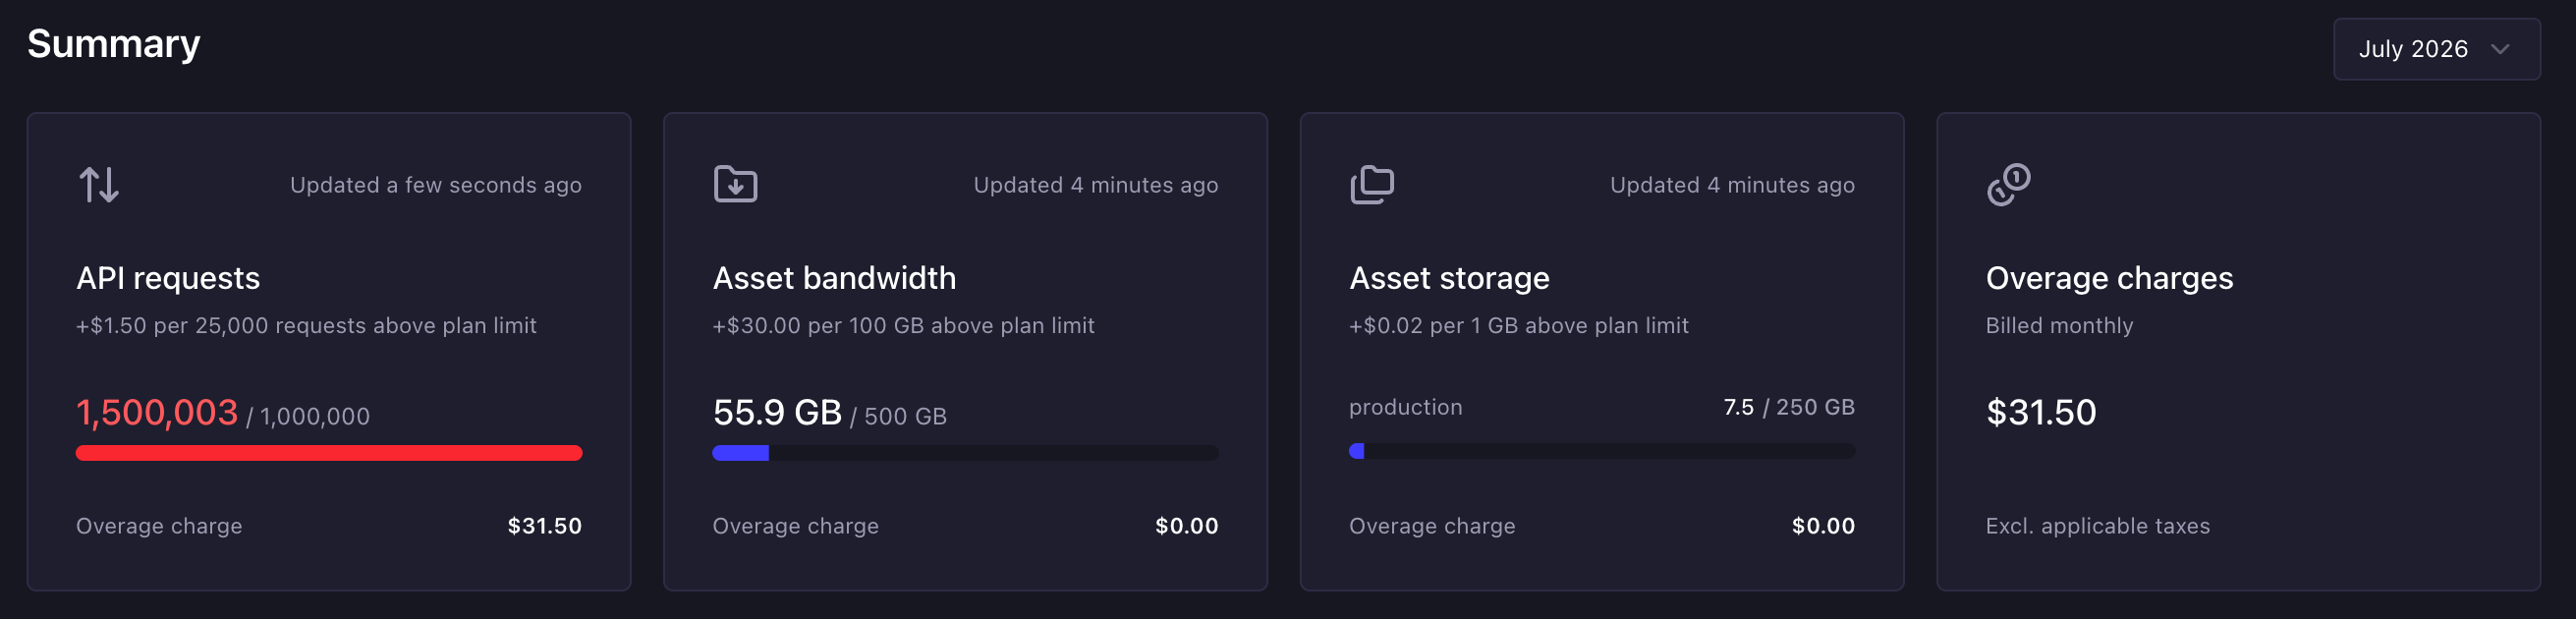
At the top of the page, the Summary section shows cards for API requests, asset bandwidth, and asset storage. Each card shows your current usage against your plan limit, the overage rate for that metric, and any overage charge accrued so far. A fourth card shows the total overage charge for the current billing period, and the month selector on the right lets you review previous billing periods.
Overages are billed monthly at the end of your billing period and are not prorated. For plan limits and billing details, see Understanding Strapi Cloud usage and billing.
Project consumption
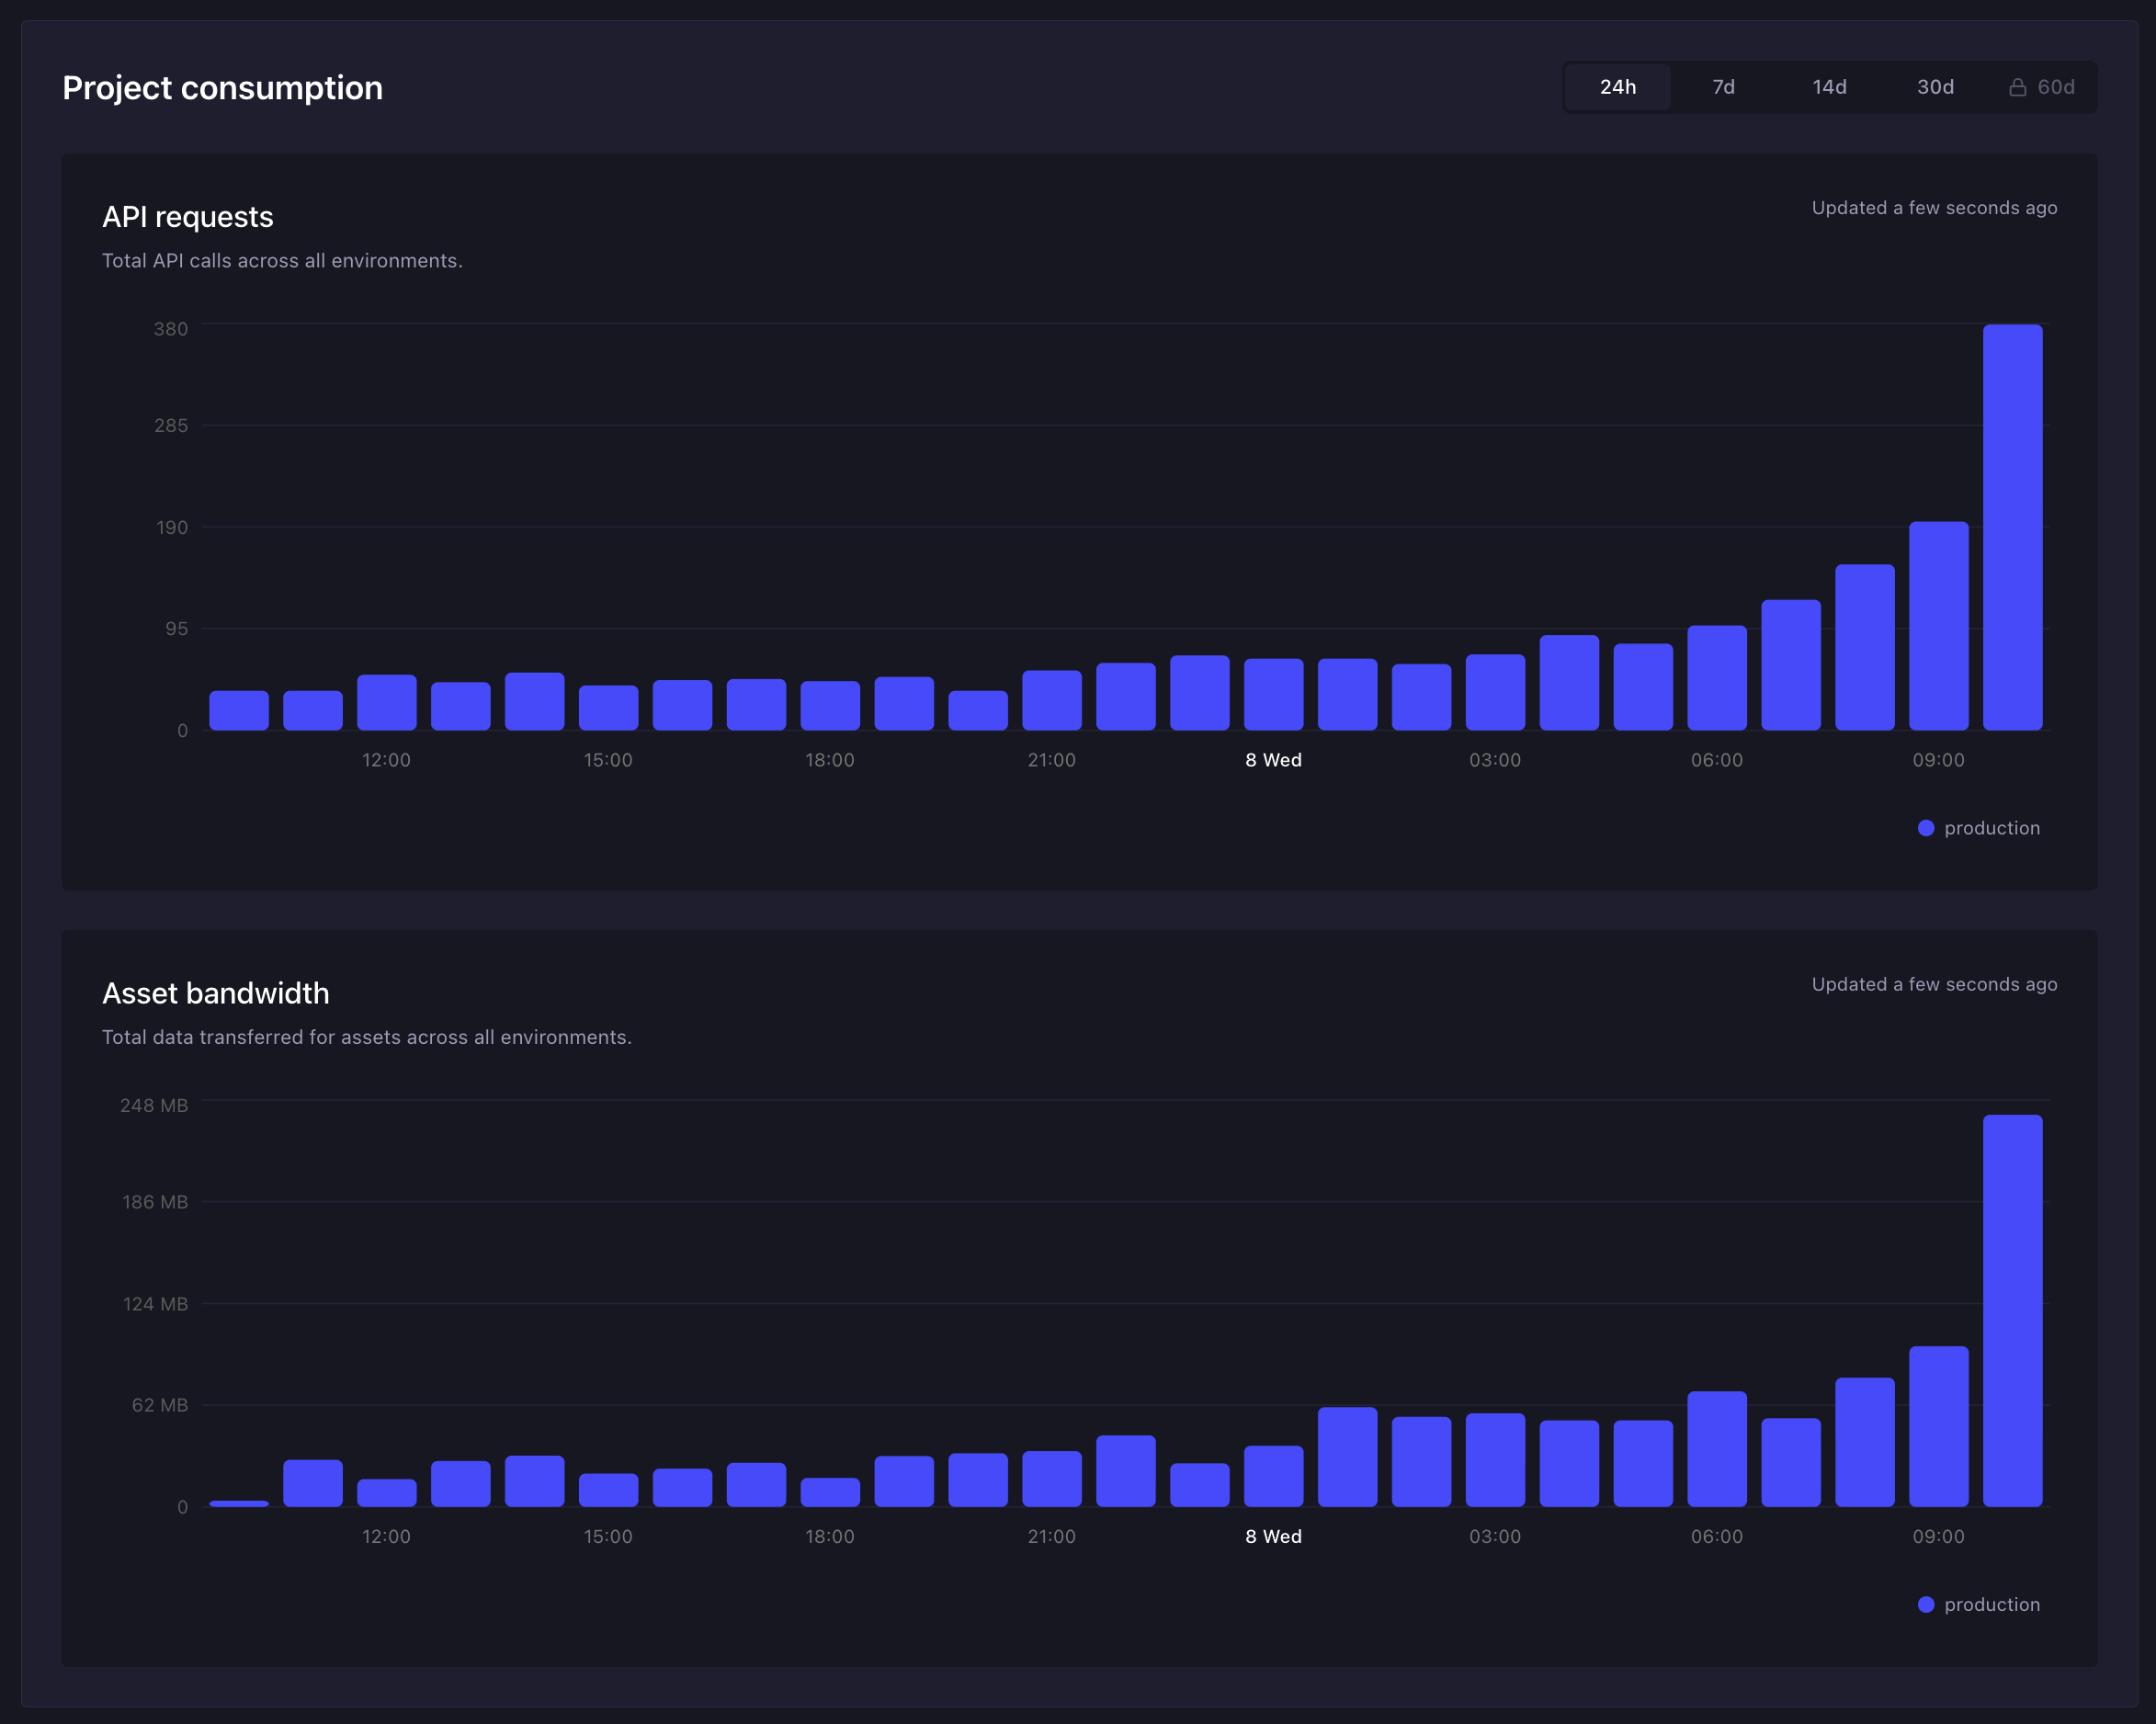
The Project consumption charts show API requests and asset bandwidth over time, broken down by environment (for example, production and test). You can switch between 24 hours and up to 60 days. The longest time ranges are available on higher plans.
Use these charts to answer "when did this start?". A gradual ramp usually means organic traffic growth. A sudden spike on a specific day points to a change: a new frontend release, a misconfigured polling loop, a crawler, or a load test. Once you know the date, correlate it with your deployments and frontend changes.
The environment breakdown also matters. If a large share of your consumption comes from a non-production environment, something in your development or CI setup is generating traffic against it.
Traffic insights
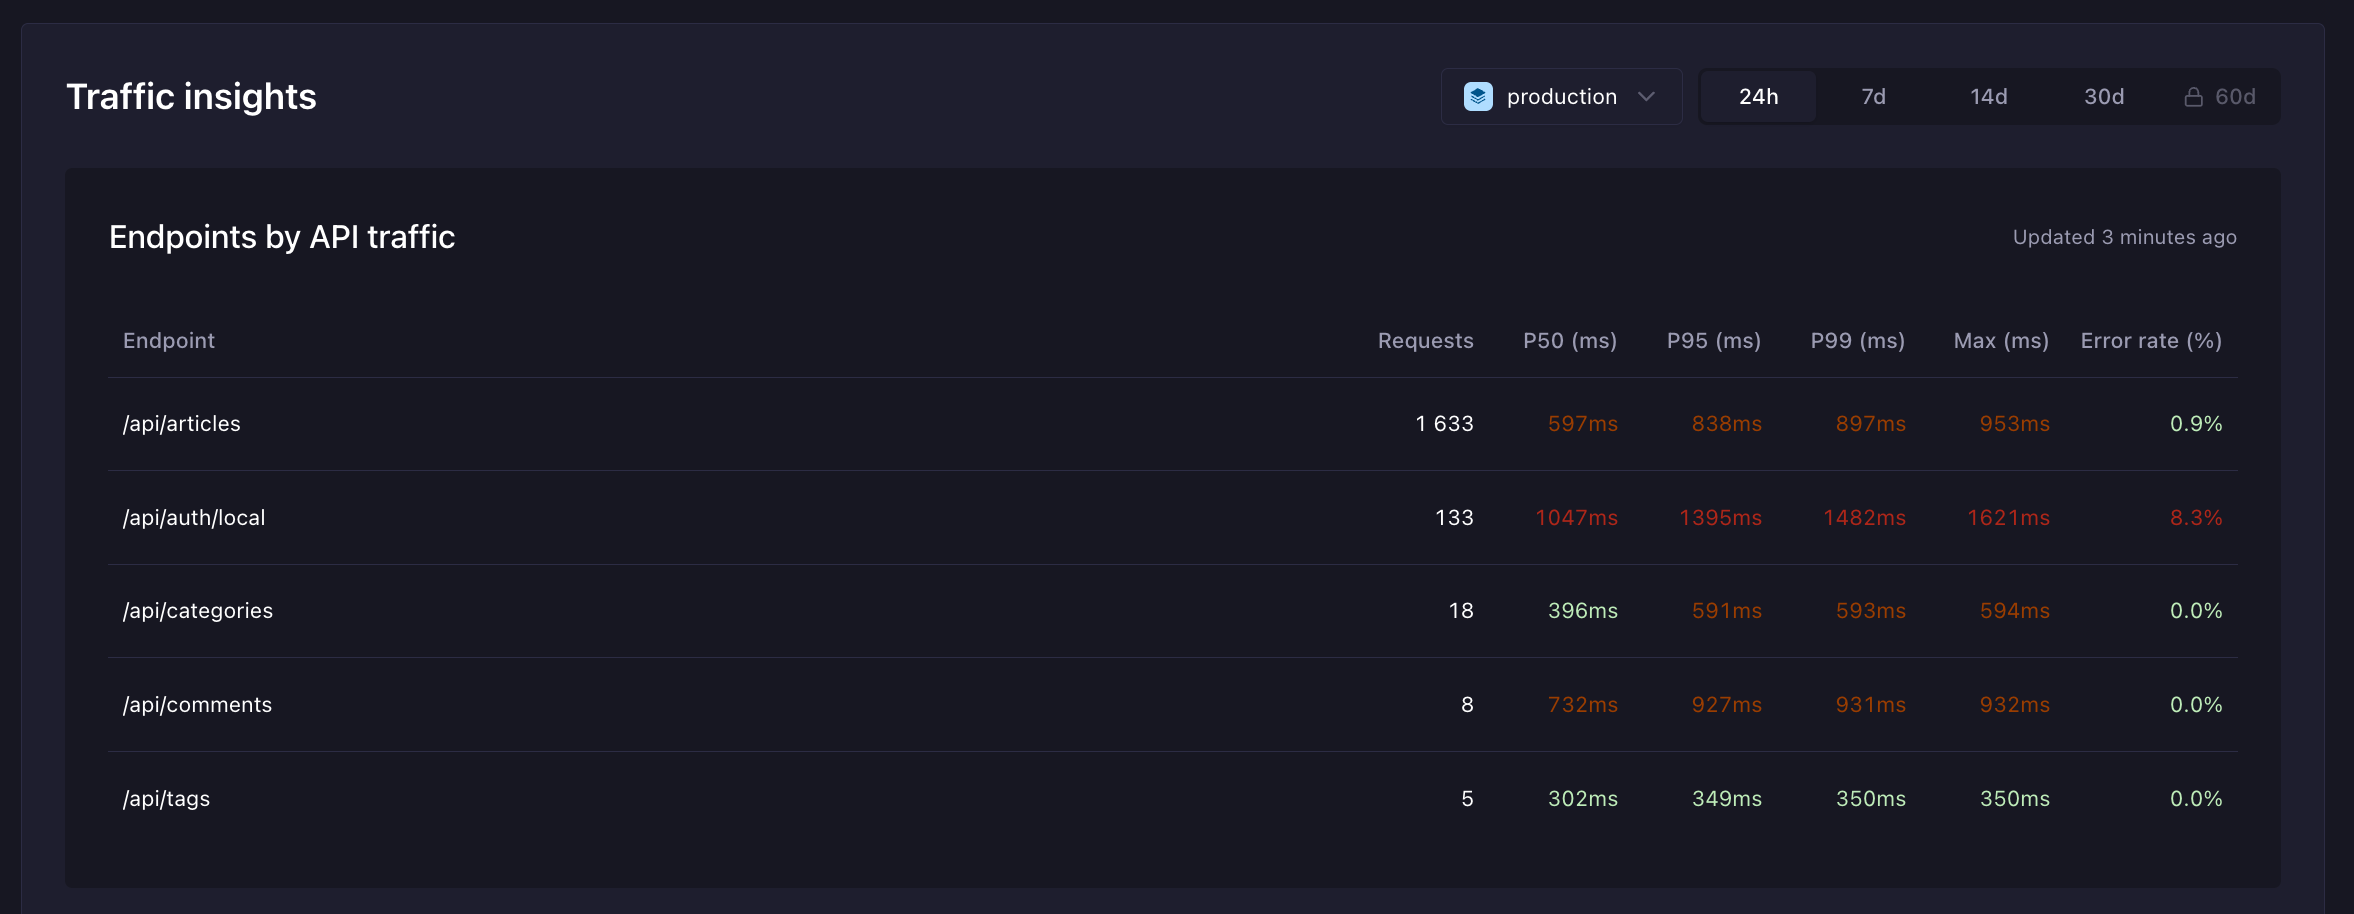
The Endpoints by API traffic table shows, per environment, which endpoints receive the most requests, along with response times (P50, P95, P99, and max) and the error rate for each endpoint.
This is the first place to look when you want to understand what is driving your API request count:
A single endpoint with a very high request count usually means the frontend is calling it more often than needed. Check for polling, missing caching, or a fetch running on every page load or component render.
Endpoints with a high error rate show where requests are failing. Requests count toward your usage even when they fail, so a client retrying a broken call in a loop can burn through your quota quickly.
High P95 or P99 response times on a specific endpoint point to expensive queries, often deep
populateusage or large page sizes on that route.
As with Project consumption, the longest time ranges depend on your plan. The 24-hour and 7-day views are enough to identify what's driving current traffic.
Assets by bandwidth usage
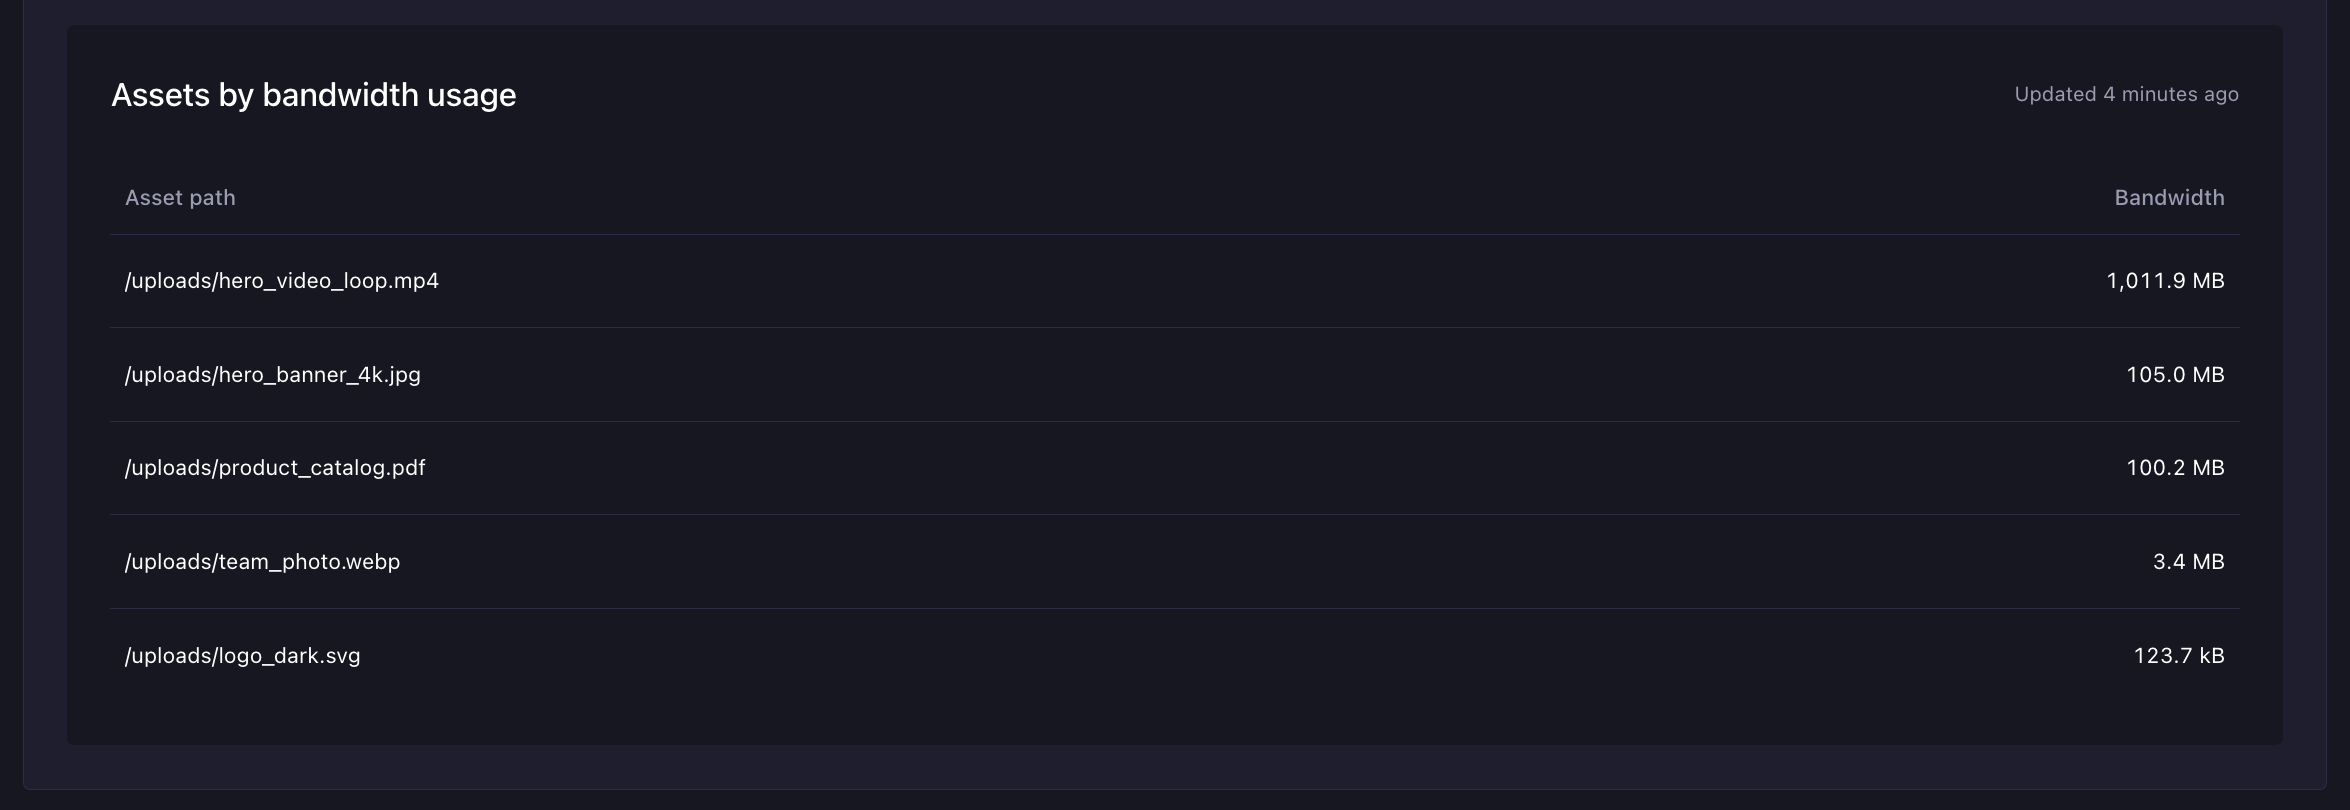
Below the endpoints table, in the same Traffic insights section, the Assets by bandwidth usage table lists the specific files that consume the most bandwidth. This makes bandwidth questions concrete: instead of wondering why you transferred 23 GB, you can see that one hero video accounts for 6 GB of it.
Common fixes once you've identified the heavy assets:
Serve responsive image formats. Strapi generates multiple sizes on upload, so make sure the frontend requests the small format for thumbnails instead of the original.
Compress large images and convert them to modern formats such as WebP or AVIF.
Host large videos on a dedicated video platform and embed them, rather than serving the file from Strapi's media library on every page view.
Cache assets in the frontend so repeat visitors don't re-download the same files.
CPU and memory
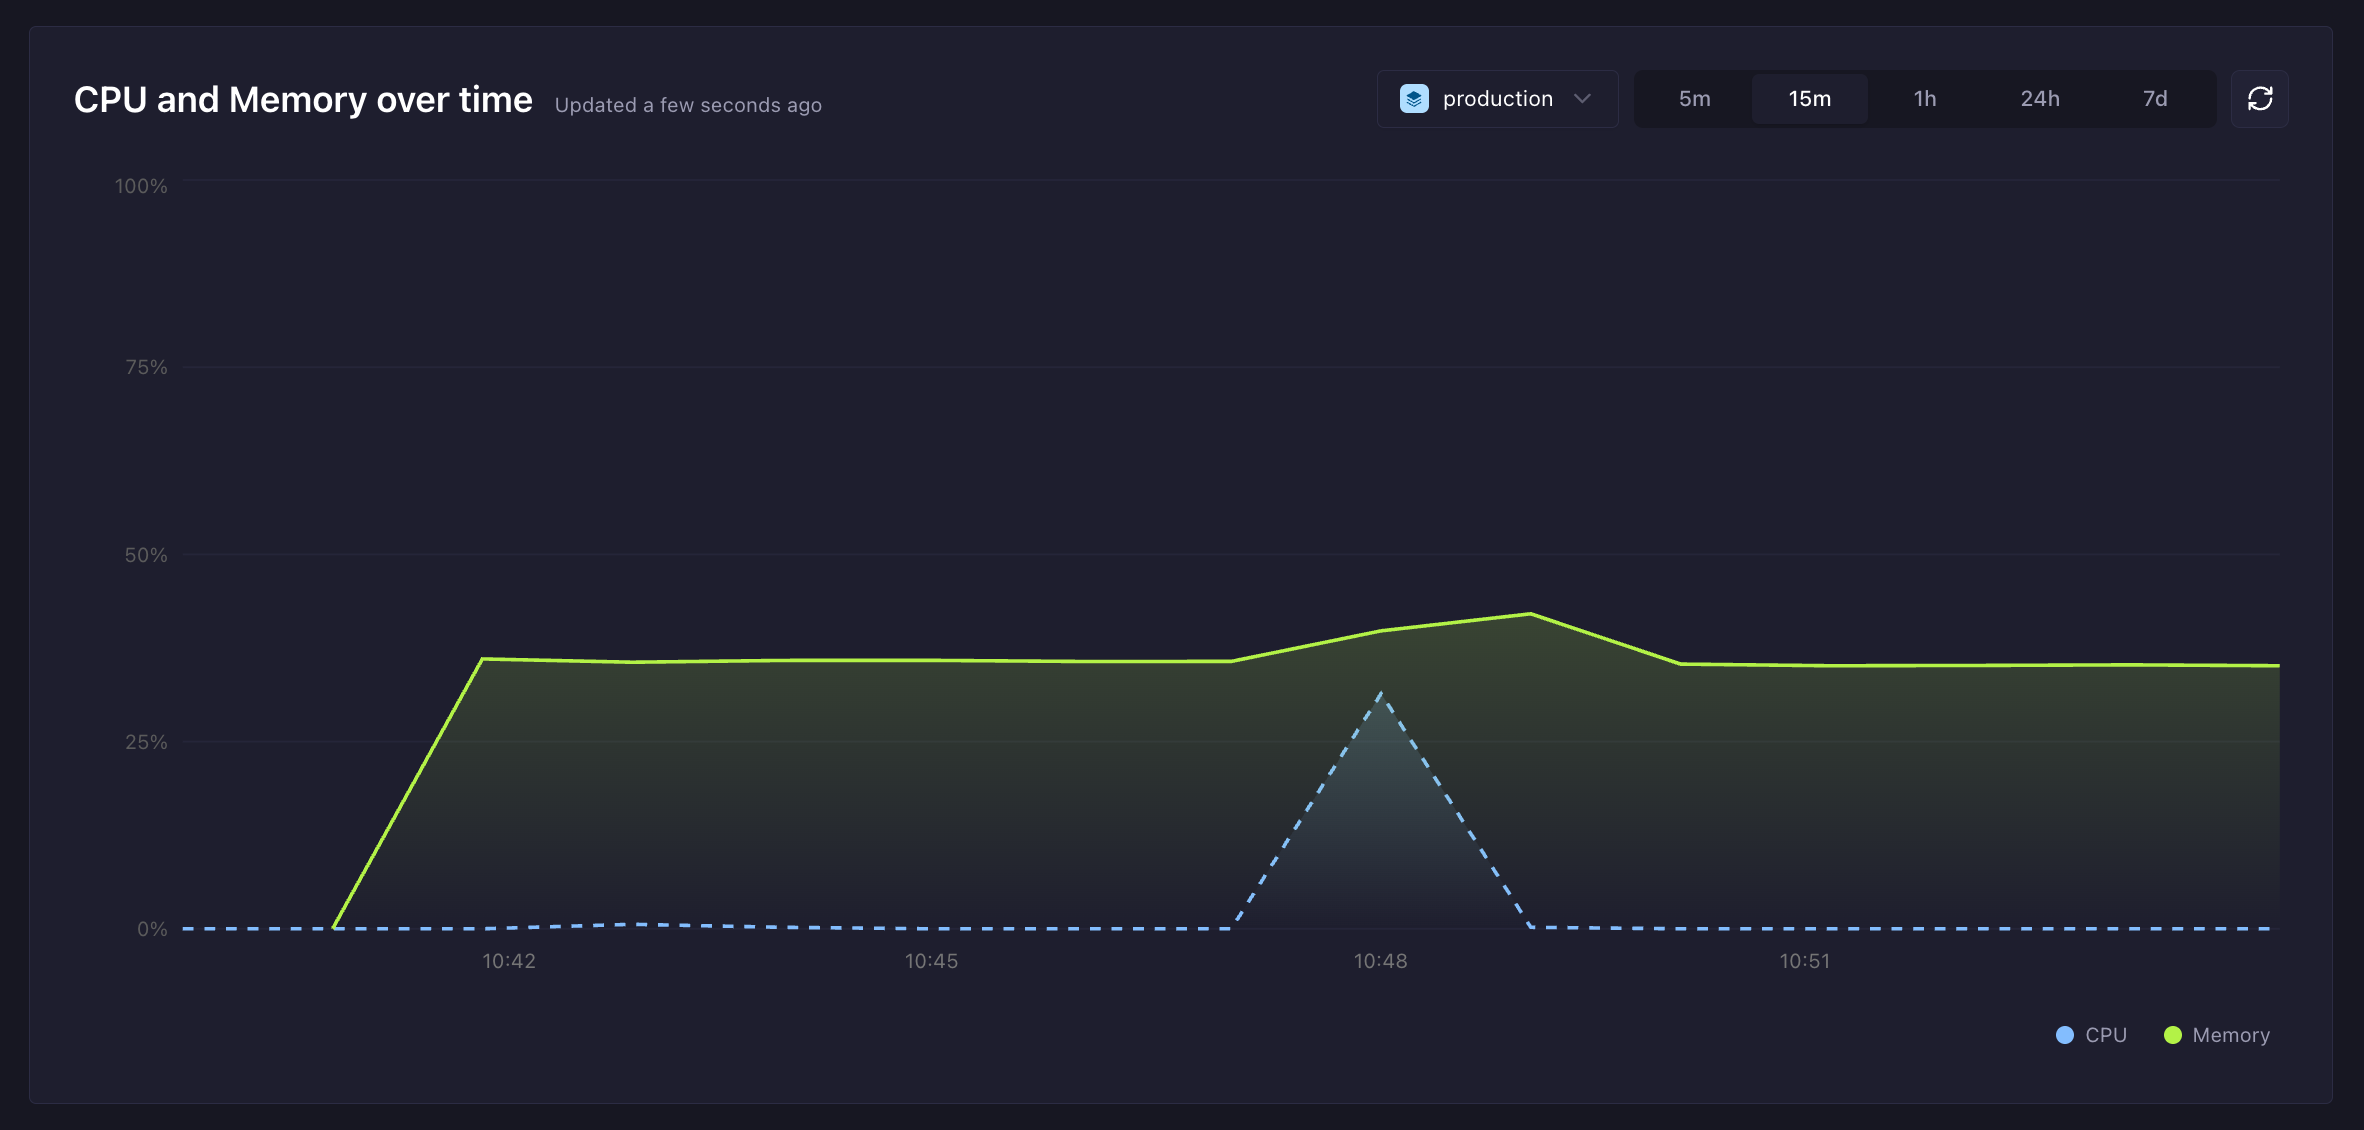
The CPU and Memory over time chart shows resource usage for the selected environment, from a 5-minute window up to 7 days.
If your application feels slow, becomes unresponsive, or restarts unexpectedly, check this chart before anything else:
Memory climbing steadily until it drops back sharply is the typical signature of a restart. Sustained memory near the top of the chart means the application is running close to its limit, and restarts are likely.
Sustained high CPU correlates with slow response times. Cross-reference the Traffic insights table to find which endpoints are expensive.
Flat, low CPU and memory during a period when the application was unresponsive suggests the bottleneck was elsewhere, such as a slow external service the application calls. That's useful information to include in a support ticket.
Answering common questions with this page
"Why is my API request count so high?" Open Project consumption to find when the growth started, then open Traffic insights to see which endpoints are being hit. The usual culprits are frontend polling, uncached server-side rendering that fetches on every page view, retry loops against failing endpoints, and bots or crawlers.
"Why is my asset bandwidth so high?" Open Assets by bandwidth usage. It's almost always a small number of large files served frequently, and the table tells you which ones.
"Why is my app slow or restarting?" Open CPU and Memory over time and look at the pattern during the affected period, then check Traffic insights for slow or high-error endpoints in the same window.
When to contact support
If the page shows an anomaly you can't explain, or usage that doesn't match what your application should be doing, open a ticket and include the project name, the affected environment, the time range where you see the issue, and screenshots of the relevant charts. That lets us investigate immediately instead of asking for this information first.